
Gold Market Overview
Gold entered the November 3, 2026 trading session under renewed pressure following significant volatility across global financial markets.
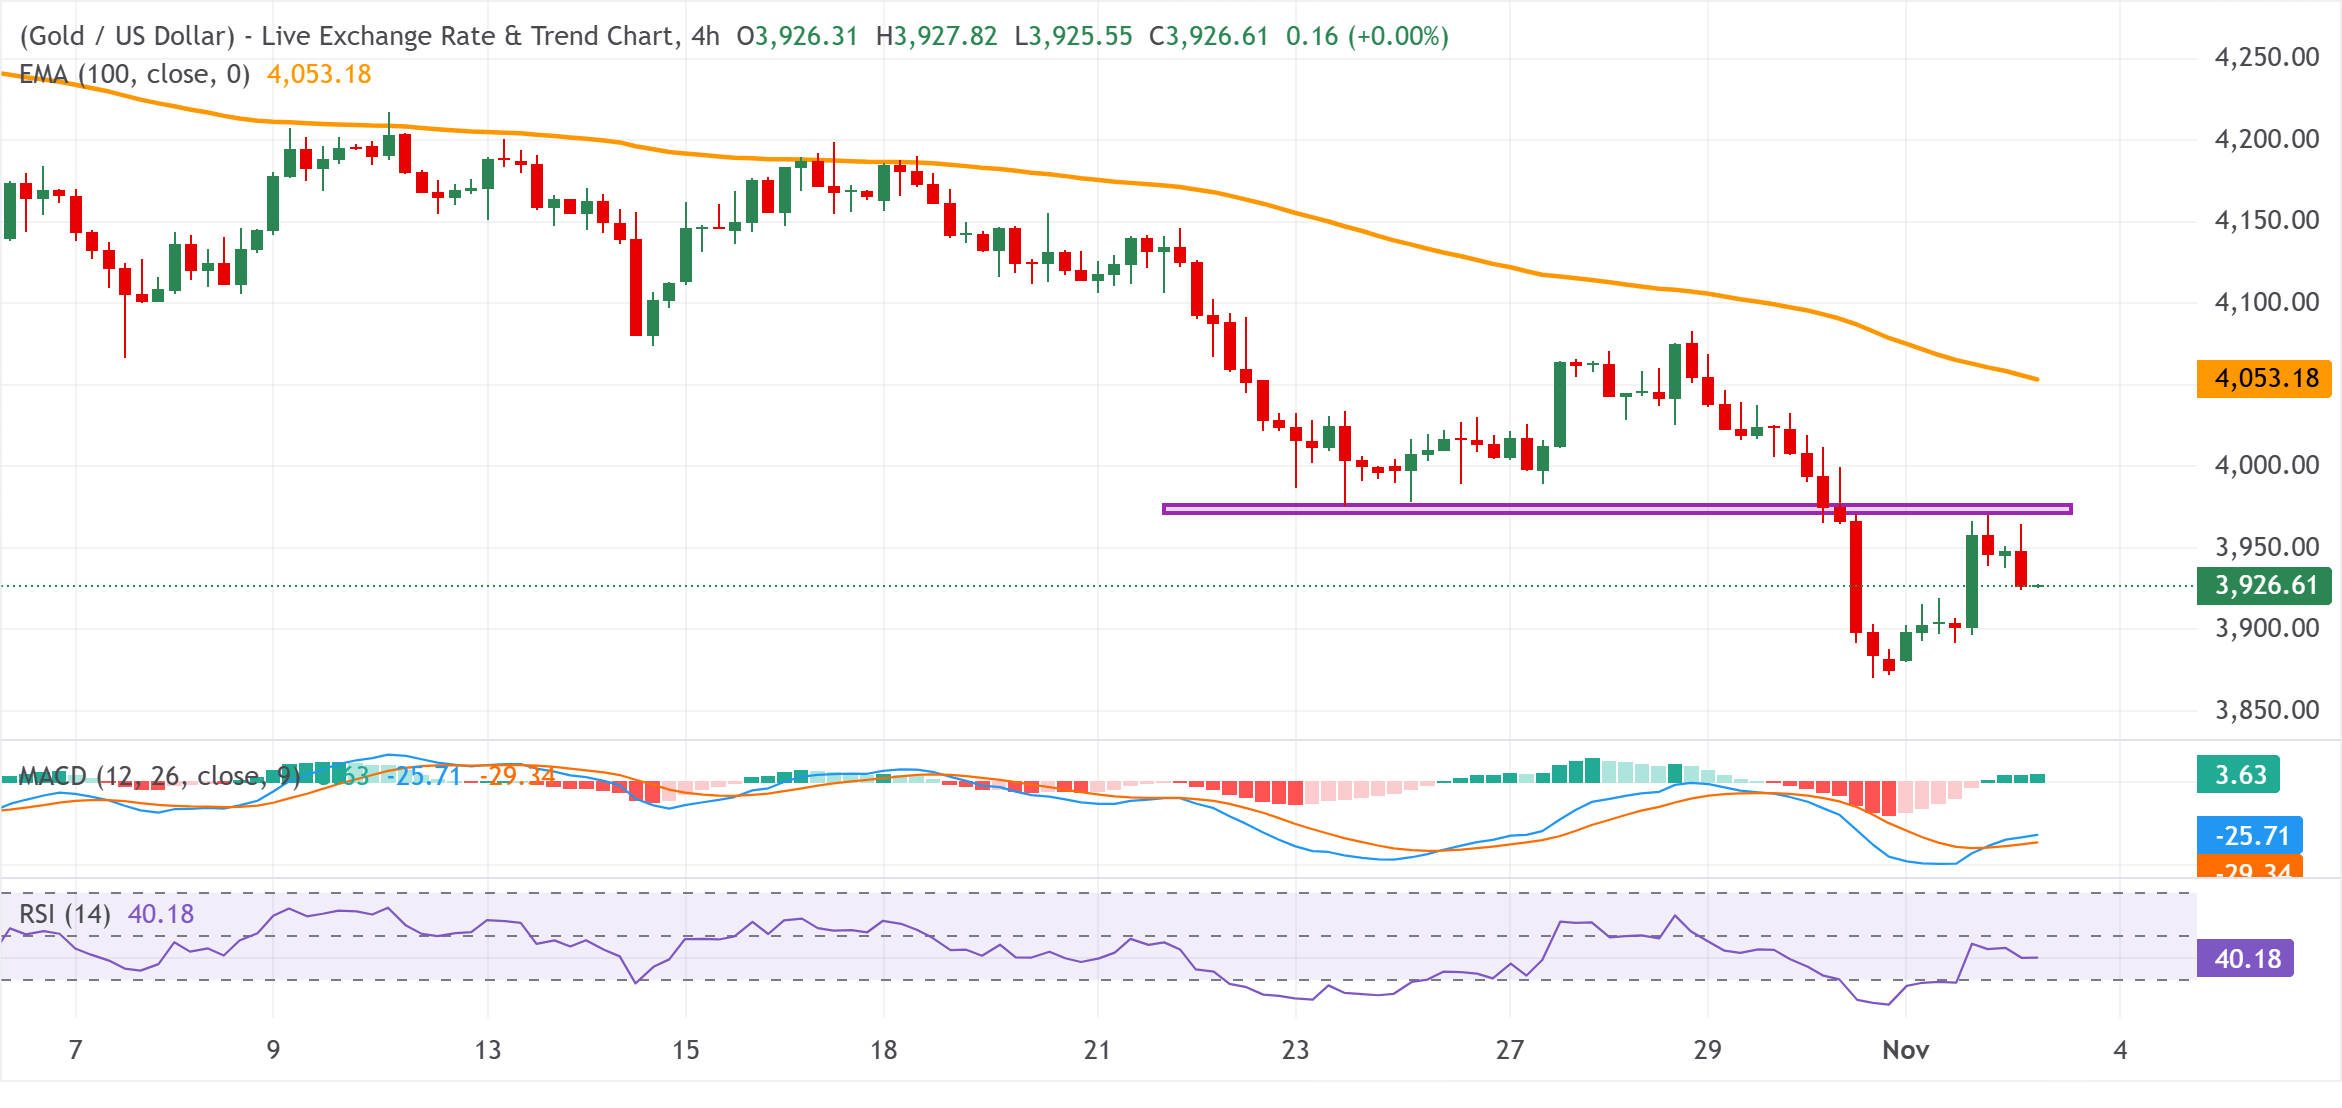
According to Reuters, spot gold declined 0.5% to $3,926.52 per ounce at 03:53 GMT, after gaining more than 2% in the previous session and reaching $3,954.41.
The recent rebound followed a sharp late-October selloff, when weakness in technology and artificial intelligence-related equities contributed to broader portfolio liquidation. Some investors sold gold to raise liquidity and meet margin requirements.
Key Factors Driving XAU/USD
1. Federal Reserve Interest Rate Expectations
Markets continue to assess the possibility of additional monetary tightening by the Federal Reserve. According to CME FedWatch data cited by Reuters on November 3, traders were pricing in approximately a 74% probability of a December rate increase at the reporting time.
Higher interest rates generally increase the opportunity cost of holding non-yielding assets such as gold, potentially creating headwinds for bullion prices.
2. US Midterm Elections
The November 3 elections may influence expectations surrounding fiscal policy, business regulation and broader equity market sentiment.
Unexpected political developments could increase demand for defensive assets. However, sharp equity losses may also trigger gold liquidation if investors need to raise cash.
3. Oil Prices and Geopolitical Uncertainty
Oil prices declined more than 7% on November 2, reducing some near-term inflation concerns. Nevertheless, geopolitical developments in the Middle East continue to create uncertainty around energy markets, inflation expectations and monetary policy.
XAU/USD Technical Outlook
Following the sharp decline in late October, gold has staged a recovery, but the broader short-term trend has not yet demonstrated a confirmed bullish reversal.
The following are indicative scenario-planning reference zones, not independently confirmed technical levels or guaranteed price targets:
Price Zone (USD/oz) | Technical Significance |
|---|---|
3,950–3,970 | Indicative near-term resistance |
3,915–3,920 | Indicative immediate support |
3,900 | Psychological reference level |
3,875–3,880 | Indicative deeper support |
These areas should be reassessed using live price charts as market conditions change.
Potential Market Scenarios
Bullish Recovery Scenario
If gold holds above the $3,915–$3,920 area and reclaims $3,950, buying interest could lead to another test of $3,970. Sustained trading above this zone would strengthen the near-term recovery outlook.
Bearish Continuation Scenario
If prices break and remain below $3,915, selling pressure may intensify toward the psychological $3,900 level. A sustained move below that threshold could shift attention toward the $3,875–$3,880 area.
Conclusion
XAU/USD remains sensitive to macroeconomic developments, Federal Reserve expectations and political uncertainty surrounding the US midterm elections. The $3,950–$3,970 region is a reference area for potential recovery, while $3,915–$3,920 is a nearby support zone to monitor.
Market participants should look for price confirmation across relevant timeframes, apply appropriate risk management and monitor changes in US monetary policy expectations.
This analysis reflects market information available at the stated reference time. It is not a trading signal or investment recommendation. Trading financial instruments involves risk.


