

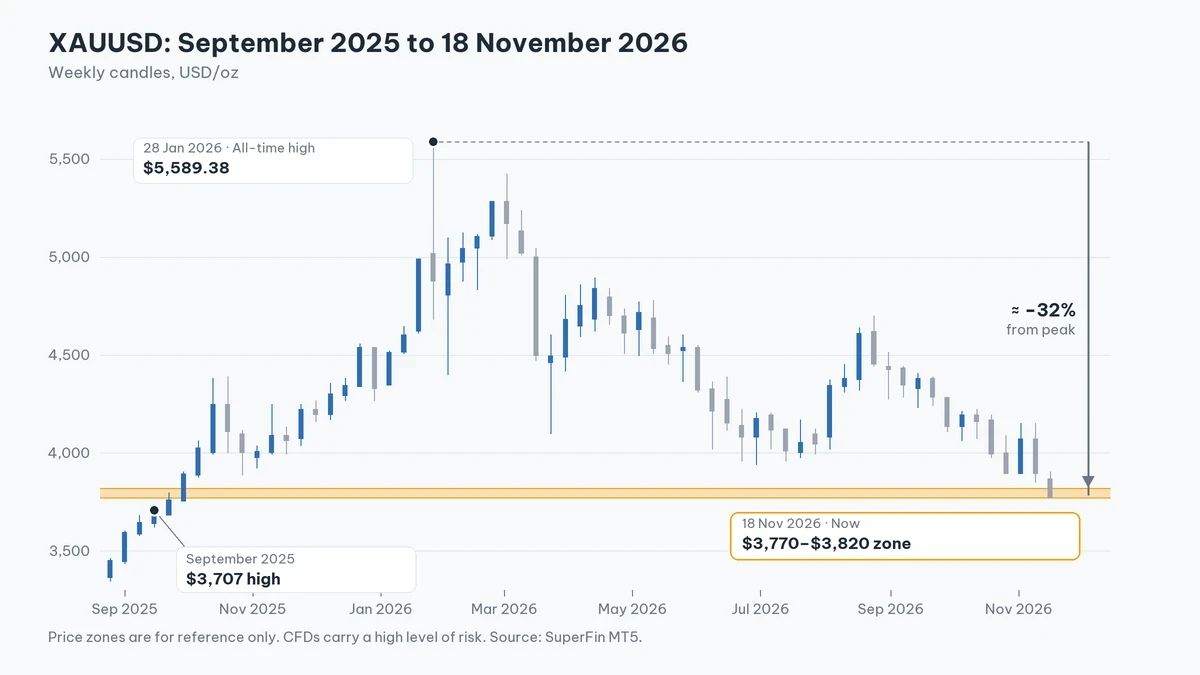
Gold (XAUUSD) is trading around $3,770–$3,820 per ounce [reference price compiled at the time of writing; recheck against the SuperFin MT5 chart before publishing], extending its slide after leaving the $4,100 area in early November. The drop matters less than where price now sits. This is almost exactly the zone where gold set a string of all-time highs in September 2025, 14 months ago.
Quick summary
Reference price: $3,770–$3,820 per oz [exact figure to be confirmed on SuperFin MT5 at the time of publishing].
Why it stands out: in September 2025 this zone was the all-time high. Gold then climbed to a record $5,589.38 (28 January 2026, per CBS News and Investing News) and has since fallen about 32% to return here.
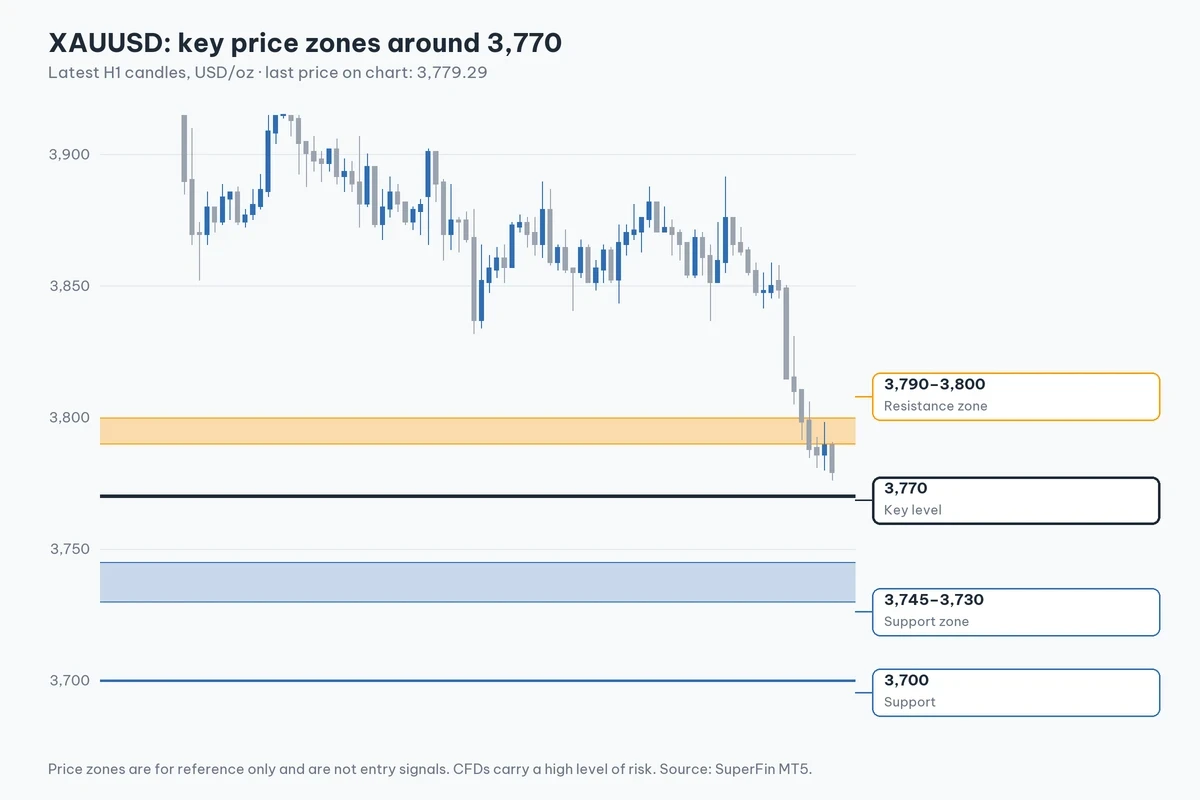
Levels to watch: holding above 3,770 could allow a bounce toward 3,790–3,800. Losing 3,770 raises the risk of a further drop to 3,745–3,700.
Current driver: the Fed held rates at its 28 October 2026 meeting (10–2 vote, per Kitco). Markets are now pricing a possible rate hike in December 2026 (Trading Economics, 30 October 2026, citing CME FedWatch, roughly 75% at that time). Higher rates reduce gold's appeal.
Why the price differs so much from our 10 November article (gold was at $4,111 then): after the 28 October Fed meeting gold slipped to around $4,035. Selling continued as rate-hike expectations spread, pushing price below the $3,900 psychological level (FXStreet, week of 13 November 2026), then to about $3,861.50 on 16 November (Kitco), and finally into today's $3,770–$3,820 range. This was a steady decline over roughly three weeks, not a data error.
1. Why $3,770 is a critical level
In technical analysis, a price zone that once acted as a high or resistance often turns into support when price retests it after breaking above. The 3,770 area is a clear example of that principle:
9–17 September 2025: gold set new all-time highs within a single week: about $3,675 (9 Sep), $3,682 (15 Sep), then an intraday high of $3,707 (17 Sep).
18 September 2025 (exactly 14 months before this article): gold pulled back about 2.2% to a low of $3,628. That day was a decline, not a peak.
22–23 September 2025: gold broke to a new high of $3,791.
29 September 2025: gold moved above $3,800.
28 January 2026: gold hit an all-time high of $5,589.38 (per CBS News and Investing News), a gain of more than 45% in roughly four months. [Note: some sources show a higher intraday peak of about $5,608 on 29 January 2026. $5,589.38 is the most widely cited figure; SuperFin should verify it independently before using the absolute number.]
Now (18 November 2026): gold has fallen about 32% from that peak and is back in the $3,770–$3,820 range, the same band it crossed repeatedly while setting records in September 2025.
In other words, the zone being retested today is the footprint of a historic rally. It is not one level from one day 14 months ago, but a whole band (roughly 3,700–3,800) that gold used to set record after record in September 2025. If the zone holds as support, as technical theory suggests, that is a constructive sign. If it breaks, it shows sellers are firmly in control compared with the earlier rally.
2. Support and resistance around 3,770
3,745–3,730 (Strength: High; Reason: Nearest support if 3,770 breaks, according to technical analyses currently in circulation)
3,700 (Strength: High; Reason: Round psychological level, and close to the September 2025 correction low)
3,790–3,800 (Strength: Medium–High; Reason: Nearest resistance if price holds above 3,770)
3. Macro backdrop driving price
28 October 2026: the Fed voted 10–2 to hold rates at 3.75%–4% (per Kitco). The statement gave no clear guidance for the next meeting.
30 October 2026: according to Trading Economics (citing the CME FedWatch tool), markets priced a Fed rate hike at the December 2026 meeting at roughly 75% at that time. [This probability changes constantly with new economic data. Check CME FedWatch at the time of publishing; do not reuse the old figure.]
Higher expected interest rates reduce the appeal of gold, which pays no yield, and have been the main source of downward pressure over the past three weeks.
Moves in the US dollar and upcoming US economic data ahead of the December Fed meeting could cause sharp short-term swings.
4. Scenarios to watch (for reference only, not investment advice)
If 3,770 holds: a technical rebound toward 3,790–3,800 is possible.
If 3,770 breaks: risk of a further drop to 3,745–3,730, and then 3,700.
These are technical reference zones. They come without specific entry, take-profit or stop-loss levels, because the article has not been checked against live SuperFin chart data. For the official version, this section should be extended with concrete trade scenarios based on the SuperFin MT5 chart, following the format of earlier market analyses (for example the 10 November 2026 gold analysis).
Conclusion
Gold's return to the $3,770 zone, where it set records 14 months ago, is no coincidence. It is a classic technical test: will old resistance hold as new support? Traders should watch how price reacts at this zone rather than opening a position just because price touched a psychological level.
Watch the economic calendar for releases that can move price sharply. Around major news, the maximum leverage on some products may be temporarily limited under SuperFin's leverage policy.
Related article: Gold price analysis 10 November: XAUUSD at 4,100 support [Vietnamese page; replace with an EN link if an English version is published]
Risk warning. CFDs are complex instruments that use leverage and carry a high risk of rapidly losing money. Price zones, historical levels and scenarios in this article are for reference only, based on data at the time of writing, and are not investment advice. Past performance does not guarantee future results.
Author: Ly Hoang · Reviewer: James Ptaszek · Data: compiled from Kitco, CBS News, Investing News, Trading Economics (CME FedWatch) and FXStreet; reference prices in this article must be rechecked against the SuperFin MT5 chart before publishing.