

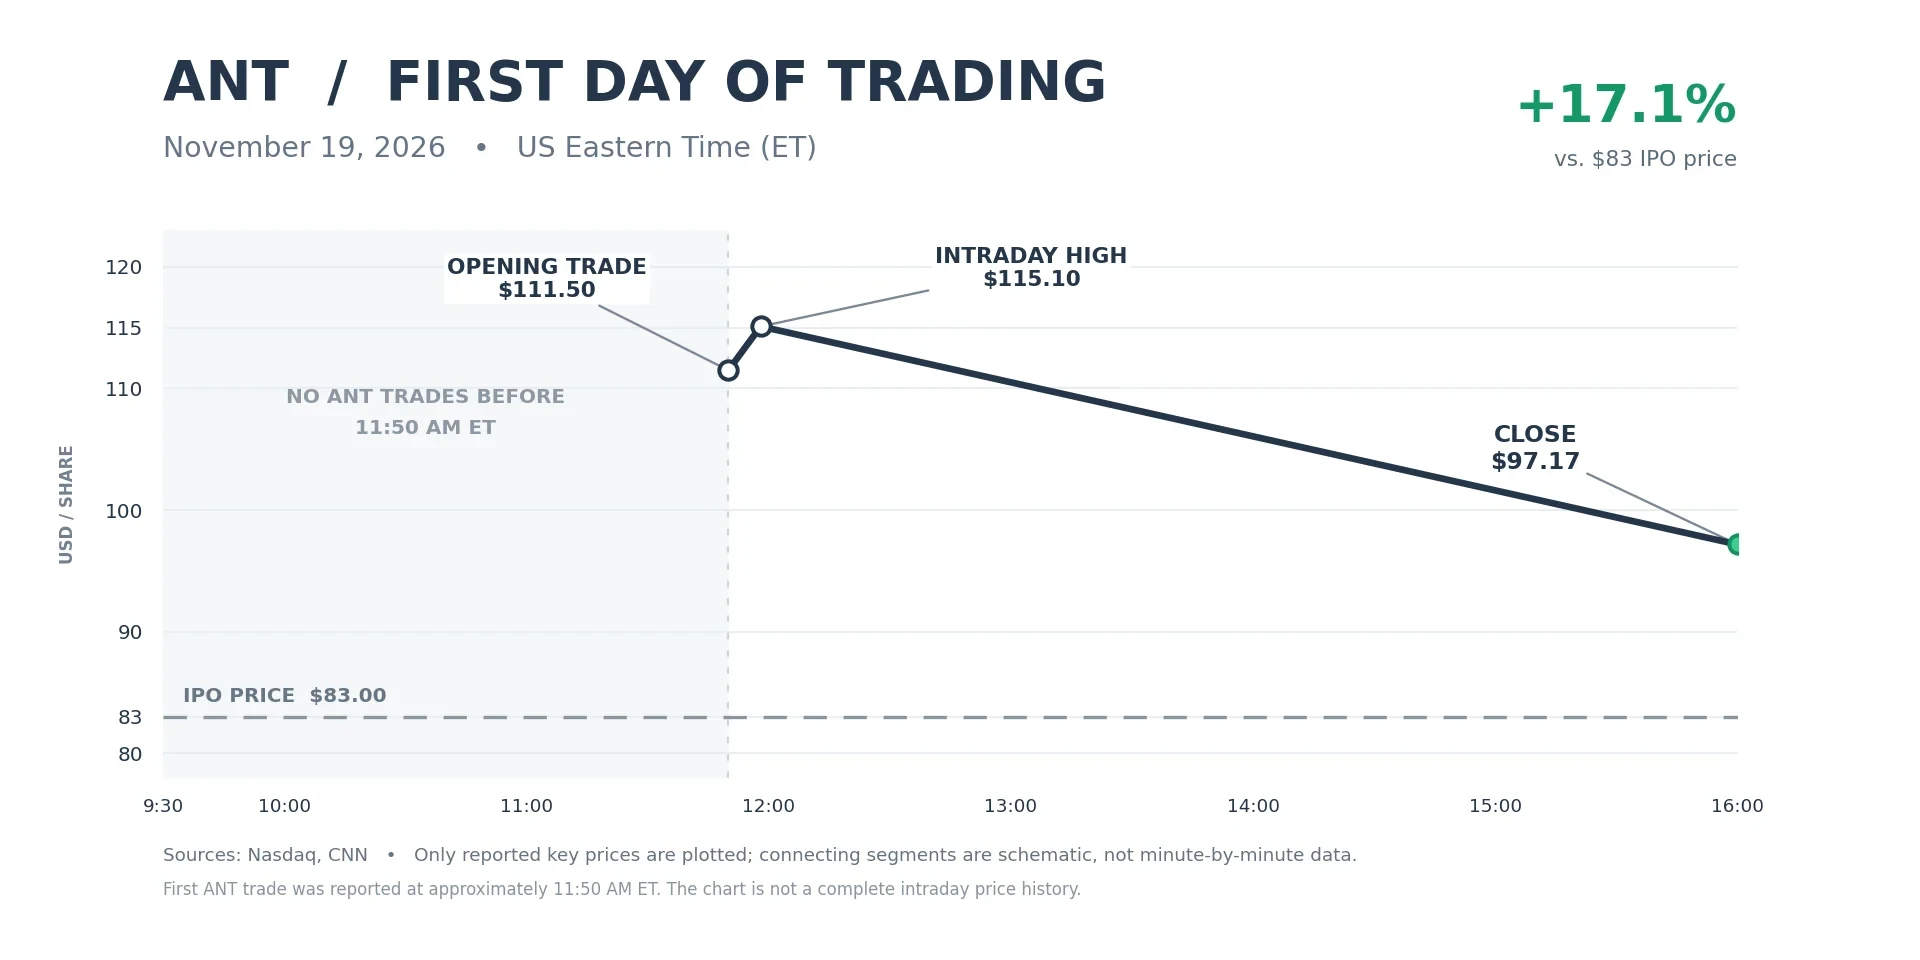
Anthropic priced its IPO at $83 per share and closed its first trading day on November 19, 2026 at $97.17, up about 17%. If ANT repeats the first-week path of SpaceX, the stock would sit near $112 by its fifth trading day; if it follows Palantir, it would sit near $101. Analysts tracked by TipRanks put the average 12-month price target at $134. None of these figures is a forecast. They are reference points built from real post-listing price data.
Anthropic IPO at a glance
Item | Figure |
Ticker / exchange | ANT / Nasdaq |
IPO price | $83 (marketed range was $70–$78) |
Shares sold | 980 million |
Money raised | about $81.3 billion, the largest IPO on record (CNN) |
First trade | $111.50 on November 19, 2026 |
Day-one high | $115.10 |
Day-one close | $97.17 (+17.1% vs. IPO price) |
Fully diluted value at close | about $1.76 trillion (CNN) |
The pattern on day one was a strong open followed by a fade. ANT opened 34% above its IPO price, then gave back about half of that gain before the close.
How ANT's first day compares with SpaceX and Palantir
We compared ANT with two of the most-watched tech listings of recent years: SpaceX (SPCX), the previous IPO record holder, and Palantir (PLTR), the data and AI software company that listed in 2020 and became one of the market's best-known AI stocks.
Stock | First trading day | Starting price | Day-one close | Day-one gain |
Anthropic (ANT) | Nov 19, 2026 | $83 (IPO price) | $97.17 | +17.1% |
SpaceX (SPCX) | Jun 12, 2026 | $135 (IPO price) | $160.95 | +19.2% |
Palantir (PLTR) | Sep 30, 2020 | $7.25 (reference price) | $9.50 | +31.0% |
One difference matters: Palantir did not hold a traditional IPO. It used a direct listing, so it sold no new shares at a fixed price. The New York Stock Exchange set a $7.25 reference price, the stock opened at $10 and closed at $9.50. Its day-one gain is measured from that reference price, not from an IPO price.
ANT's day-one gain is close to SpaceX's. Both record-size deals, SpaceX and Anthropic, rose less on day one than Palantir did from its reference price.
What happened in week one: SpaceX vs. Palantir
The first week after a big listing is often where the day-one story changes. The two benchmarks took different routes.
Trading day | SpaceX close | vs. day one | Palantir close | vs. day one |
Day 1 | $160.95 | – | $9.50 | – |
Day 2 | $192.50 | +19.6% | $9.46 | −0.4% |
Day 3 | $211.39 | +31.3% | $9.20 | −3.2% |
Day 4 | $191.82 | +19.2% | $9.03 | −4.9% |
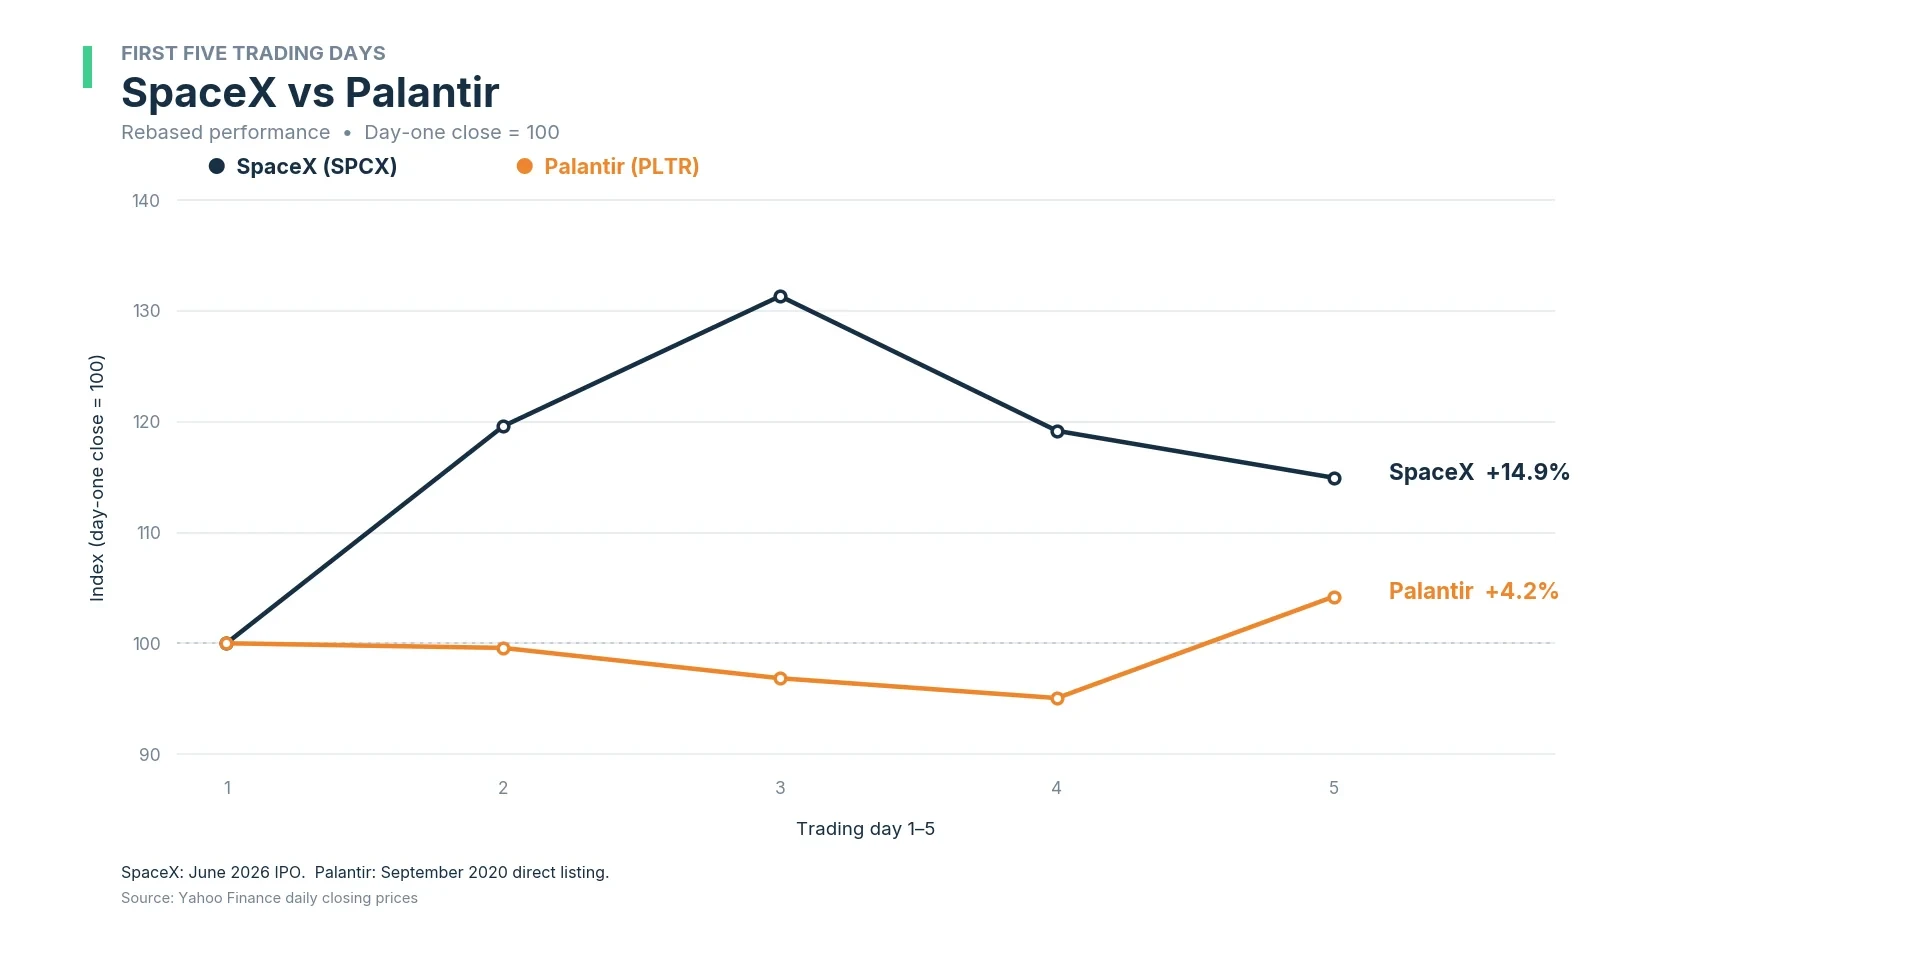
Day 5 | $185.00 | +14.9% | $9.90 | +4.2% |
Data: daily closes from Yahoo Finance. SpaceX day 5 was June 18, 2026 (US markets were closed on June 19). Palantir day 5 was October 6, 2020.
SpaceX kept rallying for two sessions after its debut, peaked at a $211.39 close on day 3, and still ended week one about 15% above its day-one close.
Palantir drifted lower for three sessions, falling about 5% below its day-one close, then jumped on day 5 to finish week one about 4% higher.
The longer run tells a different story again. As of November 19, 2026, SpaceX closed at $138.43, about 2.5% above its IPO price. Palantir closed at $153.68, more than 16 times its day-one close. Week one did not predict where either stock went next.
ANT price estimate for week one: three reference paths
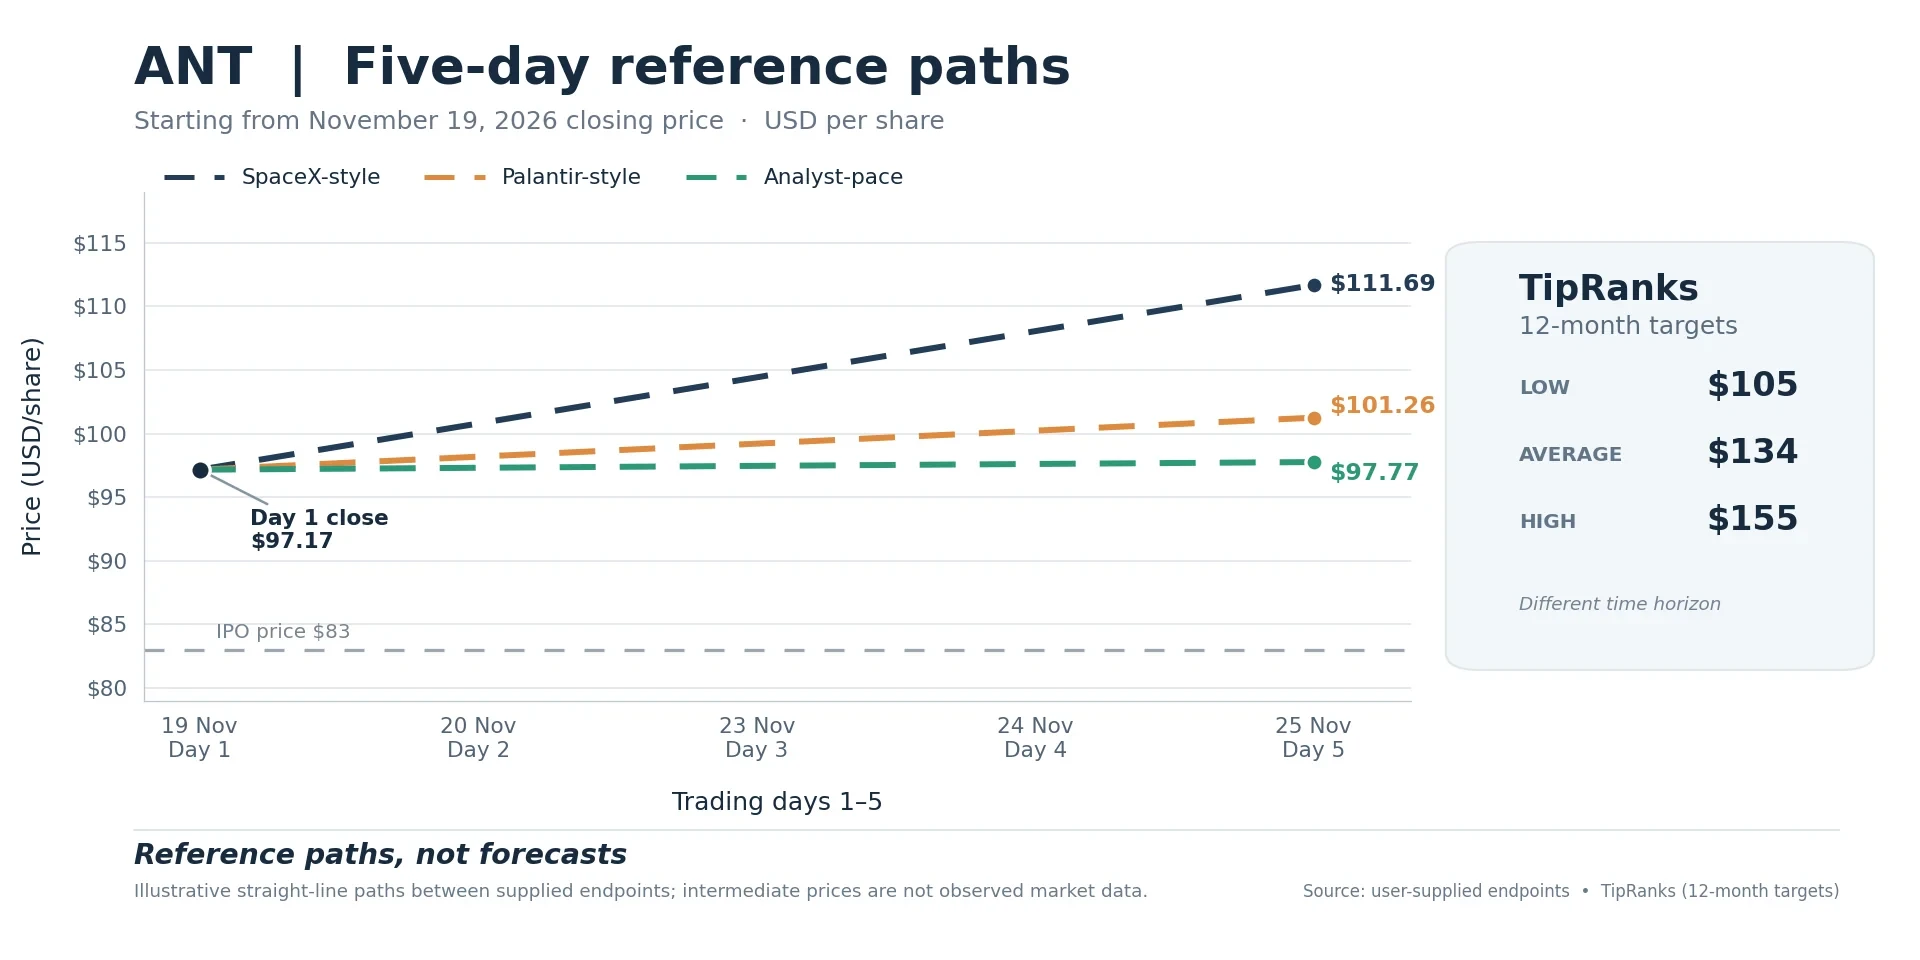
Applying each benchmark's day-1-to-day-5 move to ANT's $97.17 close gives two data-based paths. A third path spreads the analyst consensus target evenly over 12 months.
Path | Method | Implied ANT price on day 5 (Nov 25, 2026) |
SpaceX-style | $97.17 × (1 + 14.9%) | about $111.69 |
Palantir-style | $97.17 × (1 + 4.2%) | about $101.26 |
Analyst-pace (TipRanks average) | $97.17 compounded toward $134 over 52 weeks | about $97.77 |
How to read this table:
The SpaceX and Palantir paths show how wide week one can be for a high-profile listing, even when both end the week higher: about $10 apart on the same starting price.
The analyst-pace path is a straight-line calculation, not an analyst forecast. Analysts publish 12-month targets, not one-week targets, so the weekly figure only shows how small one week's share of a 12-month view is.
Palantir listed in a very different market in 2020, and through a direct listing rather than an IPO. Treat its path as a rough comparison, not a template.
Day 5 is Wednesday, November 25. US markets close on November 26 for Thanksgiving and close early on November 27.
What analysts expect over 12 months
According to TipRanks, five analysts with published 12-month targets rate ANT a consensus Strong Buy:
Measure | Price target | vs. $97.17 close |
Lowest (New Street Research) | $105 | +8.1% |
Average | $134 | +37.9% |
Highest (Melius Research) | $155 | +59.5% |
Individual calls include Needham at Buy with a $150 target, Citizens JMP at Outperform with $125, and Wolfe Research at Outperform with $135. Seaport Research started at Neutral without a target, so it is not in the average. Targets can change quickly in the first weeks after an IPO, when more banks start coverage.
What could move ANT in the next week
Broad market risk. ANT debuted on a day when the Dow fell about 2.2% and the S&P 500 about 2%, as AI stocks slid (Yahoo Finance). A new listing with no trading history can swing more than the index.
Fed expectations. Markets price a 90–95% chance of a Fed rate hike on December 9 (CME FedWatch, via CNBC). Higher rates tend to weigh on high-valuation growth stocks.
Analyst coverage. More banks are likely to start coverage once the underwriters' research quiet period ends, and new targets can shift the consensus.
Holiday trading. Thanksgiving week has thinner volume, which can make price moves sharper.
Key takeaways
ANT priced at $83, opened at $111.50 and closed day one at $97.17 (+17.1%).
In week one, SpaceX rose about 15% from its day-one close and Palantir about 4%, after very different routes.
Applied to ANT, those paths give about $111.69 and $101.26 by November 25.
The TipRanks average 12-month target is $134; spread evenly, that is only about $97.77 after one week.
Week one did not predict the long run: SpaceX now trades near its IPO price, while Palantir trades more than 16 times its day-one close.
> Risk warning. CFDs are complex instruments and carry a high risk of losing money rapidly due to leverage. Prices, paths and targets in this article are illustrations based on data available at the time of writing, not forecasts or investment advice. Past performance is not a reliable indicator of future results. Learn more about SuperFin on our Who we are page.
Author: Arjun Mehta · Reviewed by: James Ptaszek · Price data: Yahoo Finance daily closes as of November 19, 2026; analyst targets: TipRanks.